In this article I show an example of creating a bar chart with a fixed colour. This was missing from the groovychart example set, and will get included into the next build. If you are unfamiliar with groovy chart then here is an introduction to Groovychart
We simply tell the plot's renderer to use the StandardBarPainter. This turns off the gradient paint that is used by default.
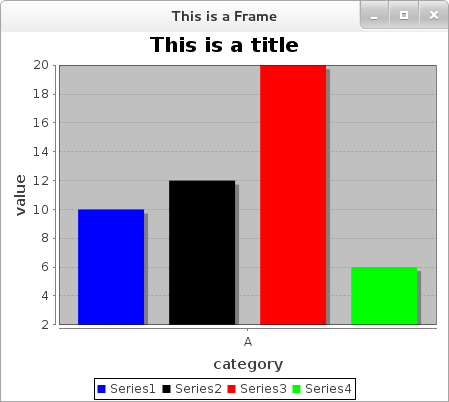
Also this example shows one way of using multiple colours in the bars, its probably not the only way and as recommended elsewhere, I suggest the JFreeChart book for anyone intending serious usage of the library.
Here is example screenshot
import com.thecoderscorner.groovychart.chart.ChartBuilder
import groovy.swing.SwingBuilder
import org.jfree.chart.ChartPanel
import org.jfree.chart.axis.NumberAxis
import org.jfree.chart.plot.PlotOrientation
import org.jfree.chart.renderer.category.StandardBarPainter

import java.awt.BorderLayout
import java.awt.Color
import java.awt.GradientPaint

/**
 * This is a simple bar chart with a few basic values that are drawn without gradients.
 */

ChartBuilder builder = new ChartBuilder();
def barChart = builder.barchart(title:'This is a title',
        categoryAxisLabel:'category',
        valueAxisLabel:'value',
        orientation:PlotOrientation.VERTICAL,
        legend:true,
        tooltips:false,
        urls:false
) {
    defaultcategorydataset {
        addValue(10.0, row:"Series1", column:"A")
        addValue(12.0, row:"Series2", column:"A")
        addValue(20.0, row:"Series3", column:"A")
        addValue(6.0, row:"Series4", column:"A")
    }

    categoryplot {
        rangeGridlinePaint Color.GRAY
        domainGridlinePaint Color.GRAY
        foregroundAlpha 1.0f

        rangeaxis {
            upperBound 20.0
            lowerBound 2.0
            standardTickUnits NumberAxis.createIntegerTickUnits()
        }

        renderer {
            barPainter new StandardBarPainter()
            seriesPaint(0, paint: Color.BLUE)
            seriesPaint(2, paint: Color.RED)
            seriesPaint(1, paint: Color.BLACK)
            seriesPaint(3, paint: Color.GREEN)
            seriesOutlinePaint(0, paint: Color.BLACK)
        }
    }
}

SwingBuilder swing = new SwingBuilder();

def frame = swing.frame(
        title:'This is a Frame',
        location:[100,100],
        size:[800,400],
        layout: new BorderLayout(),
        defaultCloseOperation:javax.swing.WindowConstants.EXIT_ON_CLOSE) {
};
frame.add(new ChartPanel(barChart.chart));
frame.setVisible(true);
These may be of interest
- Similar - Wrapping JFreeChart as a Groovy builder
- Similar - Write XML with GroovyBuilder
- Similar - Reading XML in groovy using XmlParser
- Similar - Generate an ATOM feed with GroovyBuilder
- Similar - Introduction to GSQL (Groovy SQL)

Want to let us know about something?
- If this is a library documentation page, raise a PR on the documentation site.
- Open a discussion on the Community channels
- Contact us for problems or improvements on the main site.
Supporting us
We maintain several popular embedded projects and work hard to make them even better. If you're looking for commercial services, please do consider us.
Alternatively, you can buy us a coffee to say thanks.
Sharing links
Learn about TcMenu
We build and maintain an embedded menu designer and framework that works on many platforms.