Groovychart is a library hosted on Java.net that wraps the functionality available in JFreeChart for use as a groovy builder. Currently it is available in snapshot form but hopefully time permitting, a full build will follow soon.
I really like groovy as a scripting language, it's great for writing simple UI's for displaying graphical data from many sources including XML and the database. This article helps you set up and get started with groovychart.
Firstly ensure that you have an appropriate version of both Groovy and Java.
[dave@titan groovychart-131116-snap]$ groovy -version
Groovy Version: 2.1.8 JVM: 1.7.0_45 Vendor: Oracle Corporation OS: Linux
Now you'll need to download the latest version of groovychart from the groovychart website in the downloads area, or if you prefer built from source by following the subversion link.
Once you have the groovychart distribution unzipped you'll have a directory structure similar to the following:
|-- examples
|   |-- AreaChart.groovy
|   |-- BarChartAsPNGDemo.groovy
|   |-- BmiChartStandard.groovy
|   |-- CandlestickDemo.groovy
|   |-- PieChartDemo.groovy
|   `-- TimeSeriesChart.groovy
|-- lib
|   |-- groovychart-131116-snap.jar
|   |-- jcommon-1.0.16.jar
|   |-- jfreechart-1.0.13.jar
|   |-- licence-LGPL.txt
|   |-- README-GroovyChart.txt
|   `-- README-JFreeChart.txt
|-- README.txt
`-- src
    `-- src.zip
Change into the examples directory and run the following command (replace [version] with your version of the groovychart package:
[dave@titan examples]$ groovy -classpath ../lib/jfreechart-1.0.13.jar:../lib/jcommon-1.0.16.jar:../lib/groovychart-[version]-snap.jar AreaChart.groovy
This will result in a window containing a graph:
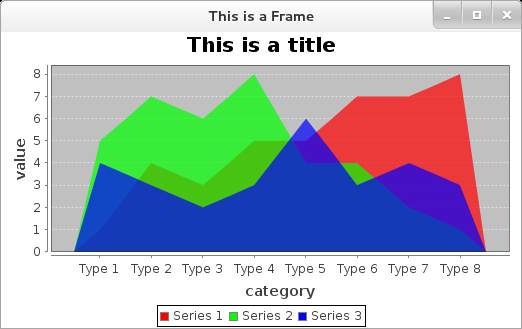
Here is the source for that example:
import com.thecoderscorner.groovychart.chart.ChartBuilder
import groovy.swing.SwingBuilder
import java.awt.BorderLayout
import java.awt.Dimension
import org.jfree.chart.ChartPanel
import org.jfree.chart.plot.PlotOrientation
import java.awt.Color
import org.jfree.chart.plot.CategoryPlot

java.sql.Connection conn = null

ChartBuilder builder = new ChartBuilder();

def areachart = builder.areaChart(title:'This is a title',
    categoryAxisLabel:'category',
    valueAxisLabel:'value',
    orientation:PlotOrientation.VERTICAL,
    legend:true,
    tooltips:false,
    urls:false
) {
    //jdbcCategoryDataset(conn:conn, transpose:false) {
    //jdbcCategoryDataset(url:'', driverName:'', user:'scott', passwd:'tiger', transpose:false){
    //     query('select foo from bar')
    //}

    defaultCategoryDataset(){
        addValue(1.0, row:'Series 1', column:'Type 1')
        addValue(4.0, row:'Series 1', column:'Type 2')
        addValue(3.0, row:'Series 1', column:'Type 3')
        addValue(5.0, row:'Series 1', column:'Type 4')
        addValue(5.0, row:'Series 1', column:'Type 5')
        addValue(7.0, row:'Series 1', column:'Type 6')
        addValue(7.0, row:'Series 1', column:'Type 7')
        addValue(8.0, row:'Series 1', column:'Type 8')
        addValue(5.0, row:'Series 2', column:'Type 1')
        addValue(7.0, row:'Series 2', column:'Type 2')
        addValue(6.0, row:'Series 2', column:'Type 3')
        addValue(8.0, row:'Series 2', column:'Type 4')
        addValue(4.0, row:'Series 2', column:'Type 5')
        addValue(4.0, row:'Series 2', column:'Type 6')
        addValue(2.0, row:'Series 2', column:'Type 7')
        addValue(1.0, row:'Series 2', column:'Type 8')
        addValue(4.0, row:'Series 3', column:'Type 1')
        addValue(3.0, row:'Series 3', column:'Type 2')
        addValue(2.0, row:'Series 3', column:'Type 3')
        addValue(3.0, row:'Series 3', column:'Type 4')
        addValue(6.0, row:'Series 3', column:'Type 5')
        addValue(3.0, row:'Series 3', column:'Type 6')
        addValue(4.0, row:'Series 3', column:'Type 7')
        addValue(3.0, row:'Series 3', column:'Type 8')

    }

    categoryplot {
        foregroundAlpha 0.7

        renderer {
            seriesPaint(0, paint:new Color(255, 0, 0));
            seriesPaint(1, paint:new Color(0, 255, 0));
            seriesPaint(2, paint:new Color(0, 0, 255));
        }
    }
}

def chartPanel = new ChartPanel(areachart.chart, false);
chartPanel.setPreferredSize(new Dimension(1000, 500));
chartPanel.setMouseZoomable(true, false);

SwingBuilder swing = new SwingBuilder();

def frame = swing.frame(
            title:'This is a Frame',
            location:[100,100],
            size:[800,400],
            defaultCloseOperation:javax.swing.WindowConstants.EXIT_ON_CLOSE);

frame.getContentPane().setLayout(new BorderLayout());
frame.getContentPane().add( chartPanel, java.awt.BorderLayout.CENTER);
frame.setVisible(true)
Other pages within this category
- Groovychart Bar chart with fixed colour
- Generate an ATOM feed with GroovyBuilder
- Introduction to GSQL (Groovy SQL)
- Reading XML in groovy using XmlParser
- Write XML with GroovyBuilder
- Wrapping JFreeChart as a Groovy builder
You'll also find me on:

Also find me here